There are no built-in apps to check CPU temperature in Windows 11. If you are tech-savvy and want to get precise CPU data directly from hardware thermal indicators, use the BIOS menu. Here are quick instructions. Be careful—this process is time-consuming, requiring you to restart your laptop and enter system mode. You will get accurate data, but not all laptop manufacturers provide it, and it may not be as informative. Additionally, you might not be able to check CPU data under load, such as while playing games or using other software.
We researched all the apps you can download to find the temp data, and here is a summary table. The best option for both newbies and tech geeks is the Camomile app. It is free, optimized for Windows 11, easy to use, and shows temperature data within ~1 minute. You can monitor CPU data dynamically, and it can apply tweaks to cool down the CPU temperature with one click. Download Camomile and check CPU temp
The best part—Camomile is a free CPU optimizer. The app monitors the CPU cores’ temperature and dynamically distributes tasks to the coolest ones – this way CPU cores avoid overheating and you forget about temperature spikes and throttling. Camomile doesn’t make any critical changes to the registry, and all changes can be reversed. It doesn’t create new keys or paths in the registry, which means there is no risk of system conflicts with other applications.
If you need a quick option, just pick Speccy. You get the temperature data in 1 minute—super easy and straightforward. This utility provides a comprehensive overview of your PC specs (CPU, RAM, motherboard, hardware settings, compatibility, etc.) and nothing more. There is no option of optimizing your system with any additional settings.
Concerns About Using Third-Party Apps
Apps that check CPU temperature on a PC work by reading data from thermal sensors embedded in the CPU and other hardware components. These sensors provide real-time temperature information through the system’s hardware monitoring interfaces, such as SMBus (System Management Bus) or PECI (Platform Environment Control Interface).
The CPU data is displayed in an easy-to-read format within the application, allowing users to monitor their CPU’s thermal performance. However, the biggest concern is that this kind of software uses low-level system calls to access these interfaces and retrieve temperature data. This level is also known as Kernel level, and applications with such access have total control of PC data, including all software and hardware settings and any data stored on the PC.
It is a concern that when you get applications to check CPU temperature, the elevated access rights can potentially allow them to infect a PC with malware, steal personal data, or even change hardware settings to the extent that would make the computer unusable with no way to recover.
If you decide to use any apps to check CPU data, you should be very careful when choosing the provider, and always double-check the risks.
Best Apps for Monitoring CPU Temperature on Windows 11: A Comparative Table
Best Software to Check CPU Temperature on Windows 11
The best solution – Shows real time CPU temperature – Optimizes CPU temperature spikes and PC performance – Temperature data in the tray – Totally free and safe.
Good solution – Average CPU temp data + each core data. – Temp data in the traySpecs of other hardware components ❌Security concerns: outdated installation certificate
Windows (11, 10, 8.1, 8, 7, Vista, and XP). 32/64-bit. AMD, Intel
Good solution – Real-time CPU and GPU temperature indicators – On-Screen Display (OSD) to check temperature while gaming – GPU overclocking settings ❌ Long path to check CPU data.
Windows (11, 10, 8, 8.1, 7), 32/64-bit support AMD, Intel
Good solution – Average CPU temp data + each core data – Alerts about high CPU temperaturesHardware monitoring and specs (RAM, motherboard, GPU) – Benchmark to measure CPU under different conditions ❌Heavy and not so friendly interface, best for tech pros
Average. ~1 min installation but don’t forget to untick the autoinstall of a third-party game.
– Real-time CPU data for each individual coreTray icons with temp data – System logs and alerts ❌Outdated certificate for the installation file ❌Third party software (games) offered during the installation process.
Windows (11, 10, 8, 7, XP), Windows Server 2003-2022, 32/64-bit support AMD, Intel, VIA x86
Easy! ~1 minute to unzip the app. No need to install it.
– Detailed system data about all hardware components: CPU, GPU, Motherboard, RAM – Logs in Excel ❌Potential security issues like with any other open-source application
Windows (11, 10, 8.1, 8, 7), 32/64-bit, Linux Intel, AMD
– Real-time monitoring of CPU temperatures, divided by cores – Temperature thresholds and alerts – Thermal throttling flags – Stress tests of CPU under load – Overclocking settings – Create and switch performance plans – Benchmarking tools ❌ Limited set of eligible models with Intel processors
Windows 10 (22H2), Windows 11 (21H2, 22H2, 23H2) Intel processors (K- and X-series)
Average. ~5 minutes. Easy but time-consuming due to a heavy installation file (268 MB)
– Real-time monitoring of CPU temperatures, voltages, and speeds – Overclocking capabilities – Profiles for custom configurations ❌ Limited set of eligible models with AMD processors
Windows 10, Windows 11 AMD only (limited set of models)
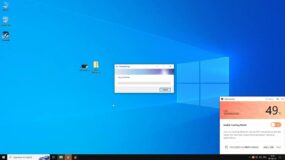
The lightweight installation file is quick and easy to set up, occupying 55MB on your hard drive. It takes about 2 minutes to download and run the app, with the CPU temperature displayed on the main screen.
CPU Temperature Features
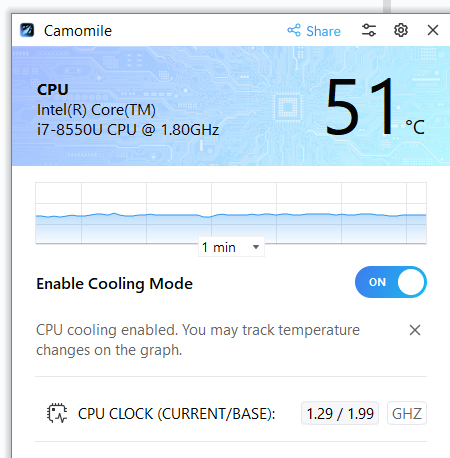
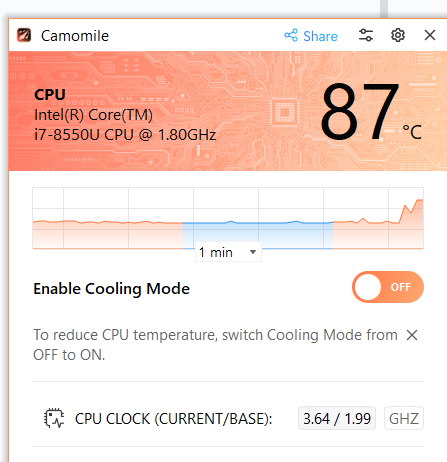
Dynamic CPU Temperature Indication: Always shows the current temperature of the hottest core for accurate data, unlike other utilities that display average temperatures. Only the highest temperature of your cores, not the average, affects the thermoregulation process on your PC, determining how fans operate and throttling settings come into effect.
Tray Menu Display: Easily check current CPU temperature while using other apps.
Temperature History: Shown via graphs in the main menu, with 1-10 minute intervals.
Other Features for CPU and Performance Optimization
One click CPU optimization: Camomile helps prevent CPU overheating through implementing the mechanism that checks the frequency dynamics of each CPU core. If a core runs at excessive CPU frequency while performing a task, Camomile switches this task to the cooler core. This is done so quickly that no core gets the chance to experience excessive frequency, which effectively prevents CPU temperature spikes. As a result, the CPU gets a performance boost.
Safe and secure CPU tweaks: Traditional tweaks to improve PC performance through overclocking enable the system to handle more demanding tasks or run applications faster, but carry the risk of crashing hardware components or system instability. You can find GPU overclocking settings in XTU, AMD Ryzen Master or MSI Afterburner.
Camomile doesn’t implement any risky optimization settings – just smart algorithms that help avoid excessive CPU frequencies. It means no potential harm to hardware or system performance.
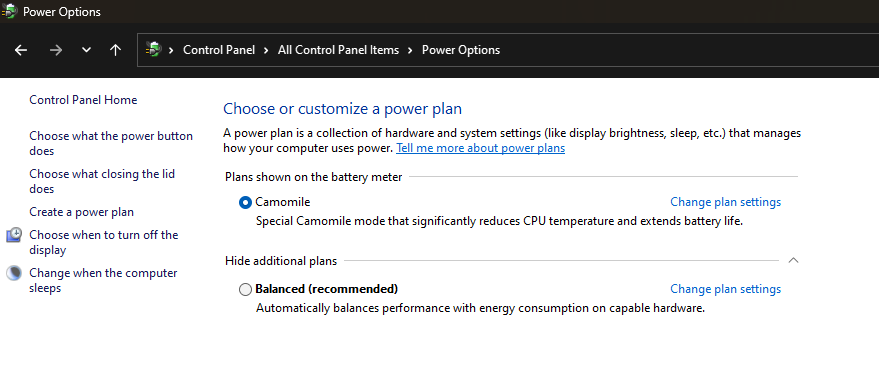
All changes made by Camomile come as a separate Windows power plan (Control Panel > All Control Panel Items > Power Options). That means, if you feel something wrong about Camomile settings or effects, just delete the Camomile power plan and you will reset all the changes.
Looking deeper into the logs and changes that Camomile creates in the registry (here is the source file), there is nothing to worry about. All changes occur in standard registry folders, no new keys or registry paths are created, which could otherwise potentially create conflicts with other keys or registry paths. That is why you can easily reverse all of the changes by simply deleting the Camomile power plan.
There is no need to clean the registry after deactivating – there are no files or folders being left after deletion, which makes Camomile an amazingly safe and clean app.
Basic Overview of the Software
Overall, Camomile is a top-choice app for CPU temperature checks and quick but efficient optimization. The only disadvantages could be its limited range of supported Windows OS versions (only Windows 11 and 10) and the lack of settings to show CPU temperature in a separate layer.
P.S. You can see how gamers can optimize CPU temperature while gaming with Camomile software:
Windows only (11, 10, 8.1, 8, 7, Vista, and XP). 32/64-bit
Chipset Support:
AMD, Intel
Price:
Free version available. Premium version – $19.95
Security:
Outdated certificate for the installation file, expired on 10/18/2022
Effort to Check CPU Temperature
It takes about 1 minute from visiting the website to seeing the final results. The installation file is 3MB and sets up quickly. However, it could be easier—the installation file was flagged as not secure by the browser, requiring additional steps to download.
CPU Temperature Features
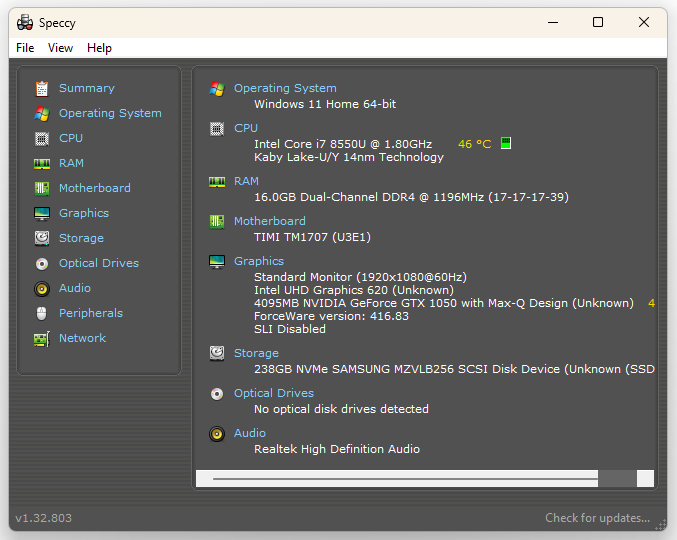
Real-time CPU temperature monitoring, displayed in the main interface and optionally in the system tray.
View the temperature of each CPU core and the average CPU temperature across all cores.
Other Features for CPU and Performance Optimization
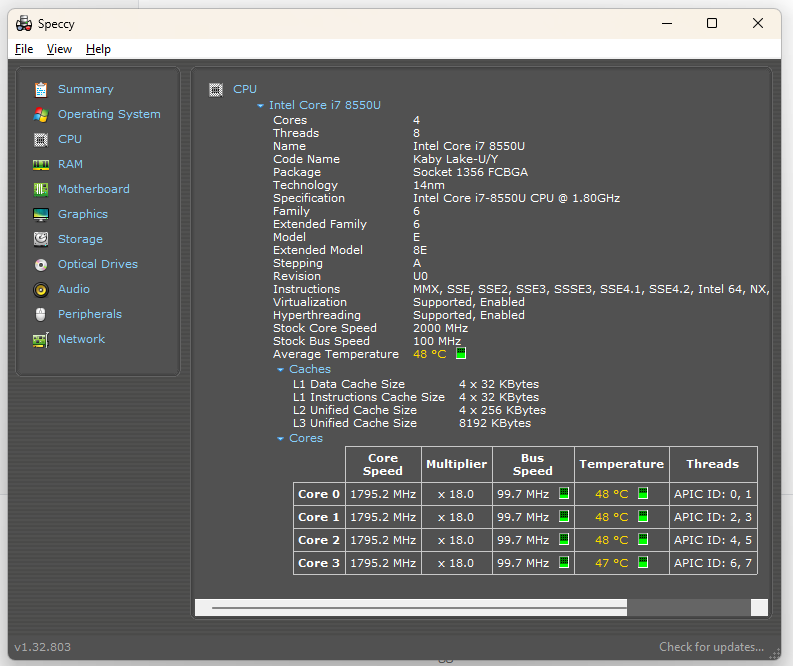
Comprehensive CPU details, including model, manufacturer, core count, clock speed, and cache sizes.
Insights into current CPU performance and compatibility with other hardware components.
Core specifications for other hardware components: hard drive, motherboard, GPU, etc.
Users can save snapshots of their system’s state, including CPU data, to track performance over time and document changes like new cooling solutions or RAM upgrades.
Basic Overview of the Software
Speccy is valuable for a wide range of users, from casual PC owners to tech enthusiasts and IT professionals. It simplifies the process of diagnosing hardware issues, planning upgrades, and verifying system configurations. By consolidating all essential information in one place, Speccy saves time and effort compared to manually gathering data from multiple sources.
We didn’t like it that the installation file’s certificate expired in 2022, which makes the installation process longer and raises concerns about the app’s security.
Installation file certificate is valid till 10/16/2025
Effort to Check CPU Temperature
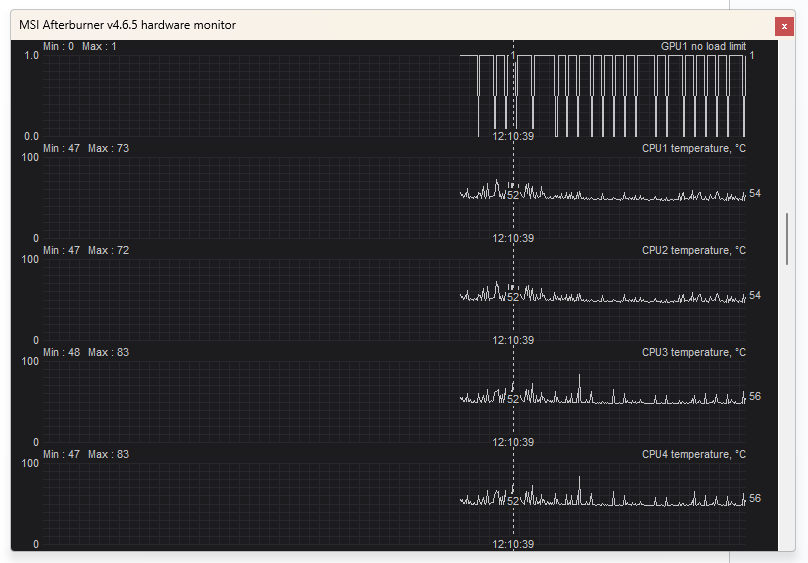
It takes about 3 minutes to check the temperature. The straightforward download and installation process leads to the main screen, where you can find temperature data, but it covers the GPU, not the CPU. To check CPU data, you need to open the “Detached Monitoring” window, where you can see graphs and temperature data for the CPU, GPU, RAM, and how they change over time.
CPU Temperature Features
Real-time CPU temperature indicators
Shows temperature on the On-Screen Display (OSD) while gaming or running other applications
Other Features for CPU and Performance Optimization
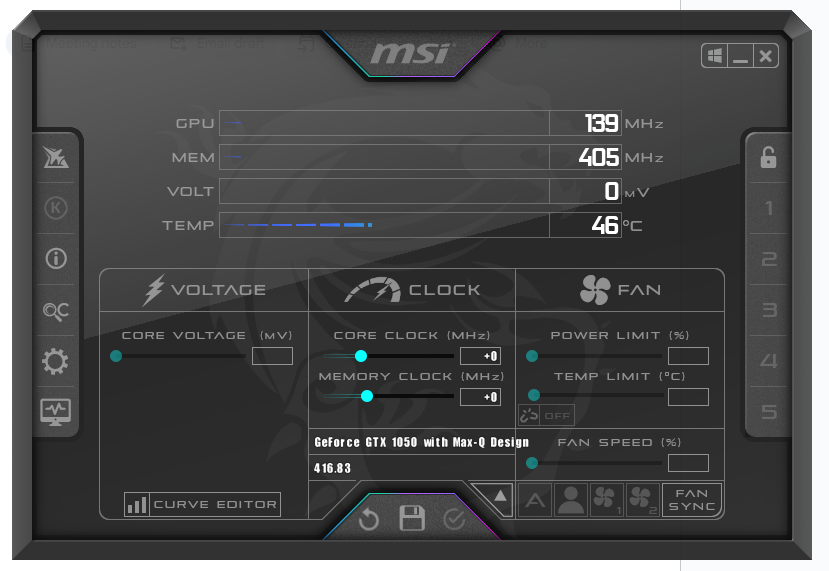
Easy and precise access to GPU settings, allowing users to overclock their graphics cards by adjusting core voltage, core clock, memory clock, and fan speeds. The OC Scanner feature can automatically find the highest stable overclock settings. Here is a quick guide on CPU undervolting.
Create custom fan speed curves to optimize cooling performance and maintain optimal temperatures during high workloads.
The Predator software integrated into MSI Afterburner allows users to record gameplay or overclocking sessions without significantly impacting performance.
Basic Overview of the Software
Overall, MSI Afterburner is a comprehensive tool that assists in GPU overclocking and provides essential monitoring and optimization features to enhance PC productivity.
It has an intuitive interface and a wide range of settings for graphics card optimization and fan control.
Can check CPU data in the free version. Pro version starts from $29
Security:
Installation file certificate valid till 8/12/2024
Effort to Check CPU Temperature
It takes about 3 minutes from visiting the website to seeing the final results. The installation file is 12.7MB and sets up easily. Although the installation file certificate is signed and valid, the web browser may block the download, treating it as unsecure.
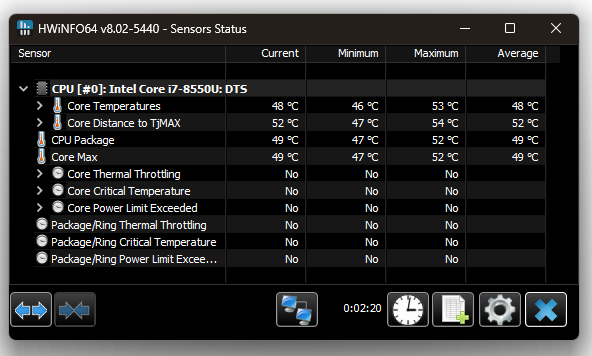
After installation, the interface is somewhat confusing, with three system windows and no clear indication of where to find the temperature data. This information is located in a separate “Sensors” menu, which may take an average user more time to find than expected.
CPU Temperature Features
It displays temperatures for individual cores and the overall CPU package.
Users can set alerts about high temperatures to help them take preventive actions. Metrics can be displayed in various formats such as tables, graphs, and system tray icons.
Other features for CPU and performance optimization
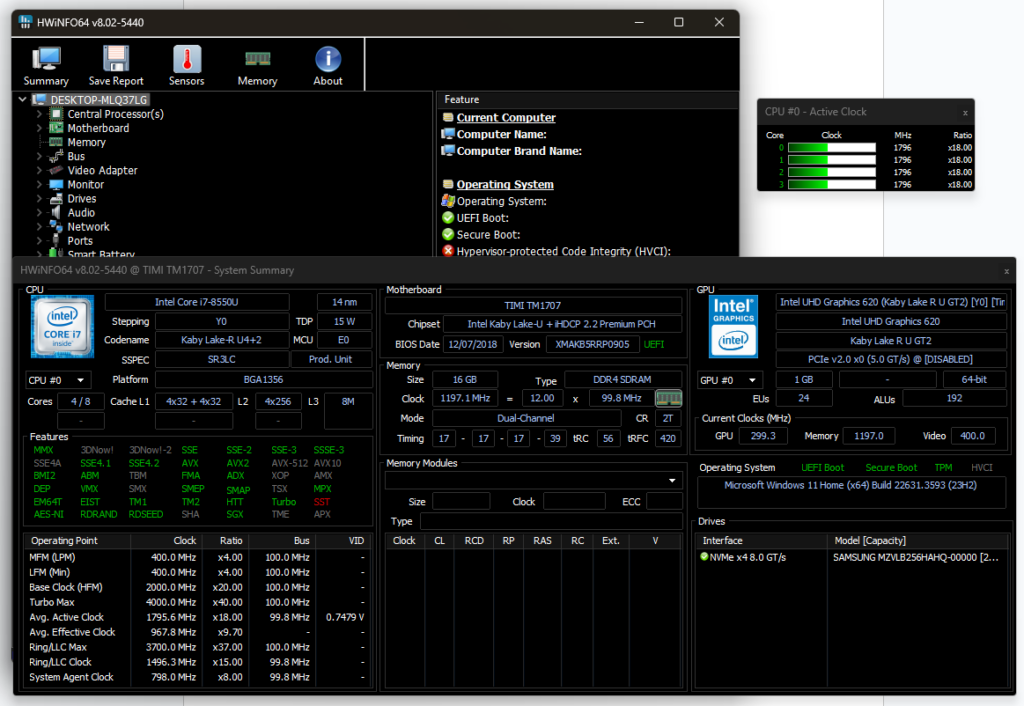
The app provides extensive CPU details including clock speeds, usage, power consumption, and thermal design power (TDP). It also offers in-depth analysis of other components such as the motherboard, RAM, and GPUs.
Benchmarking features allow users to measure CPU performance under different conditions, useful for comparing performance before and after optimizations or hardware upgrades.
Basic Overview of the Software
HWiNFO is a powerful tool for anyone needing detailed and accurate information about their computer hardware. This tool is designed for more advanced PC users rather than novices—the interface is quite complex and features a variety of tabs, categories, and indicators.
Generally, it has a good interface, but newcomers might get stuck navigating and locating specific performance indicators and alerts.
Windows (11, 10, 8, 7, XP), Windows Server 2003-2022, 32/64-bit
Chipset Support:
AMD, Intel, VIA x86
Price:
Totally Free
Security:
Outdated certificate for the installation file, expired on 05/18/2024. Integration of a third party software offer (games) during the installation process.
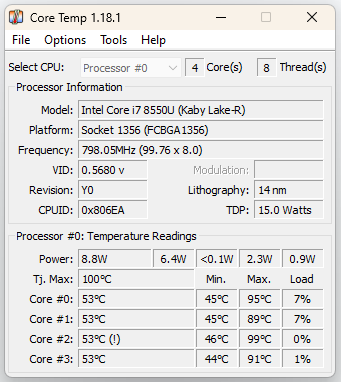
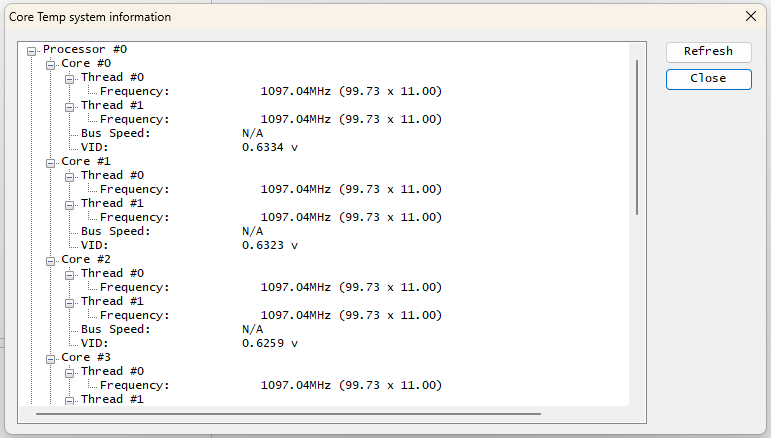
Main Core Temp menuCPU temp data in tray menuGeneral system information
Effort to Check CPU Temperature
It takes about 1 minute to check the temperature with this app. The installation file is lightweight (1.2 MB), safe, signed, and installs very easily. The process could be a bit shorter and simpler, but during installation, you need to untick the offer to install third-party apps and additional plugins.
CPU Temperature Features
Core Temp provides real-time temperature readings for each individual core of the processor, displayed directly in the app window.
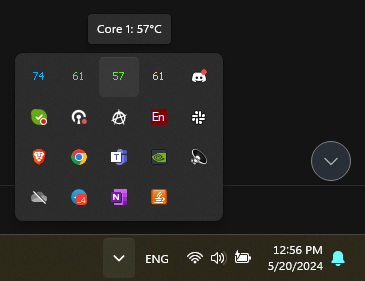
You can set up system tray icons to show temperatures at a glance.
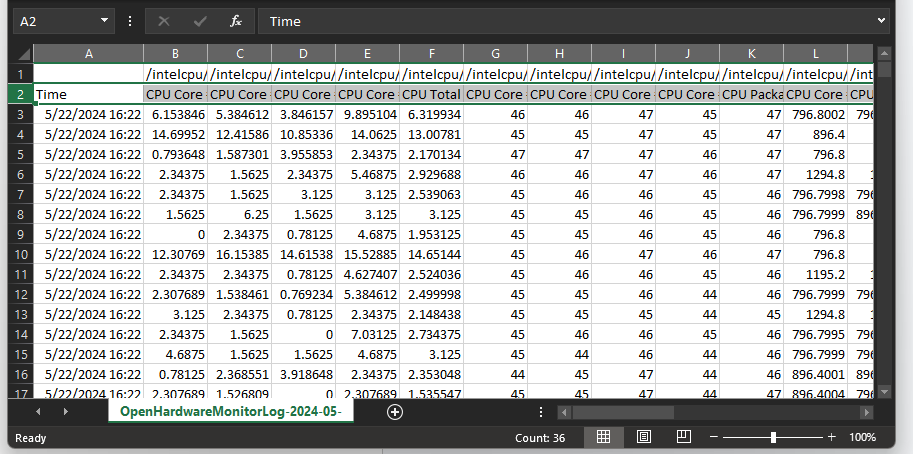
Users can log temperature data over time, useful for diagnosing intermittent issues or understanding long-term temperature trends. Logs can be exported for further analysis or sharing with technical support.
Core Temp can be configured to alert the user or perform actions (such as shutting down the system) if the CPU temperature exceeds a specified threshold.
Other features for CPU and performance optimization
Besides temperatures, Core Temp displays detailed information about the CPU, such as the model, platform, frequency, and core count, providing a comprehensive view of the processor’s specifications and performance.
Leverages the Digital Thermal Sensor (DTS) built into modern x86 processors, offering more accurate and higher resolution temperature readings than conventional onboard thermal sensors.
Basic Overview of the Software
Core Temp is a lightweight, compact program that monitors CPU temperatures and other vital information. It does not provide comprehensive info about other computer hardware components (motherboard, GPU, etc.) like similar apps do, but it professionally solves the goal of CPU monitoring with very friendly navigation and design.
A third-party application (game) is included in the installation file and could be installed on your PC if you don’t untick it, which can be a nuisance. The expired certificate for the installation file also raises additional security concerns.
Due to these points, we wouldn’t recommend Core Temp as an optimal solution to check CPU temperature.
Potential issues like with any other open-source applications
Effort to Check CPU Temperature
Very easy, takes about 1 minute. You don’t even need to install this app. Just unzip the archive, and you will immediately see the CPU indicators.
CPU Temperature Features
You can set up CPU temperature logging and its frequency. All records are collected in a separate Excel file, recording changes every second, minute, or hour.
Other features for CPU and performance optimization
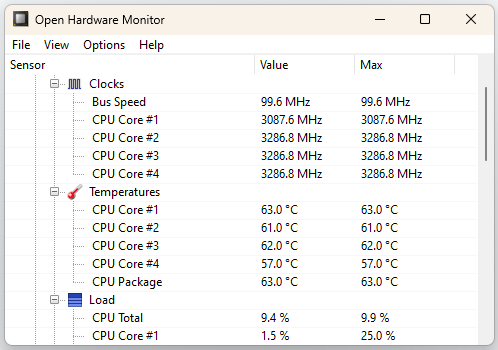
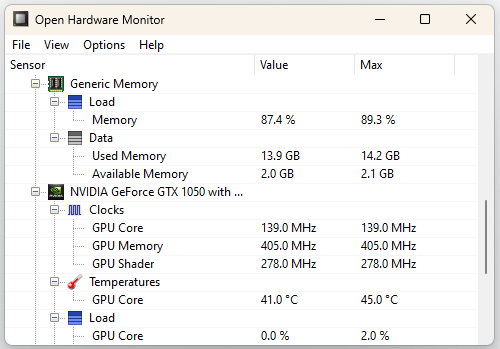
Open Hardware Monitor provides a comprehensive view of all hardware parts: motherboard, RAM, GPU, hard drive. There are no additional features for optimization.
Basic Overview of the Software
This is the best solution for those needing quick data about CPU or other hardware parts and nothing more. It’s a lightweight app that runs from any folder on your PC. There are no options for PC optimization, overclocking, or customization. It supports Linux OS, which can be especially valuable to IT pros and software developers.
Taking into account the security concerns common to all open-source projects, we wouldn’t consider this app a top solution. However, it meets our goals effectively.
Installation file certificate is valid till 03/06/2025
Effort to Check CPU Temperature
Quite easy, taking about 2 minutes to check CPU data. The mid-sized installation file (47MB) and an easy, predictive installation process lead directly to the home screen where your temperature data is shown.
CPU Temperature Features
Real-time monitoring of CPU temperatures, displaying package and individual core temperatures.
Users can set temperature thresholds and receive alerts when these are exceeded.
Thermal throttling flags indicate when the CPU reduces its speed to prevent overheating.
Users can perform stress tests to check the CPU’s thermal performance under load and adjust settings based on results.
Other features for CPU and performance optimization
Adjust CPU multipliers, core voltage, and cache ratios to increase performance. Users can overclock individual cores or the entire processor.
Create and switch between performance profiles automatically based on running applications, optimizing settings for different usage scenarios.
Built-in benchmarking tools to measure performance gains from overclocking and stress tests to ensure system stability.
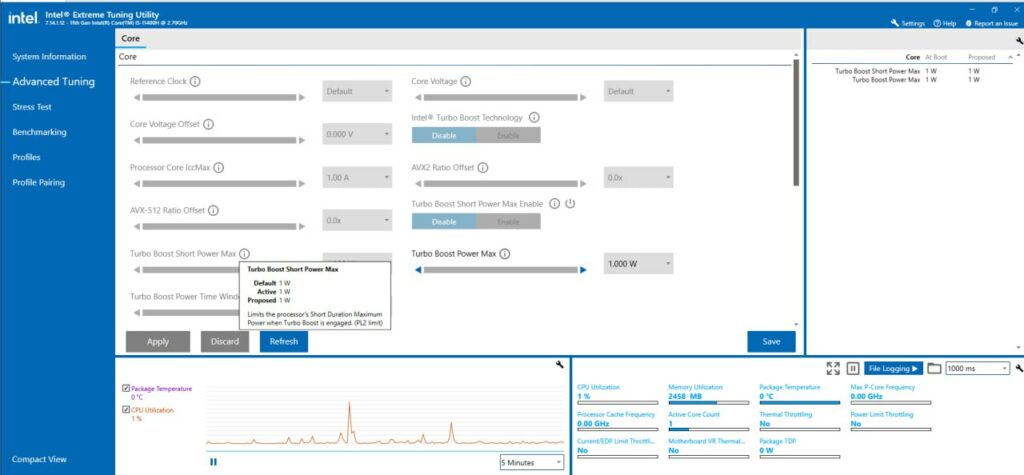
Basic Overview of the Software
Intel XTU is a Windows-based utility for K and X series Intel processors. It helps with overclocking, monitoring, and stress testing systems equipped with Intel processors. It offers robust performance tuning features suitable for both novice and experienced enthusiasts, providing a user-friendly interface to enhance system performance.
At the same time, it is an easy-to-use utility to check CPU temperature if you don’t need additional features or goals.
Installation file certificate is valid till 05/03/2027
Effort to Check CPU Temperature
Easy but time-consuming, about 5 minutes. The heavy installation file (268 MB) makes the process a bit harder than expected. The good news is that after the lengthy download and installation, the app displays the CPU temperature directly on the home screen.
CPU Temperature Features
Provides real-time monitoring of CPU temperatures, voltages, and speeds, allowing users to track thermal performance.
Other features for CPU and performance optimization
Overclocking capabilities, enabling users to adjust CPU core clock speeds, memory frequencies, and voltages.
Includes up to four profiles for custom configurations and supports integrated Radeon graphics adjustments.
Basic Overview of the Software
Overall, it is a comprehensive utility designed for overclocking and performance tuning of AMD Ryzen processors. It balances comprehensive data and usability, providing many indicators that are well-structured and easy to access. It offers detailed monitoring, profiling, and tuning options, making it a versatile tool for enthusiasts seeking to optimize their system’s performance.
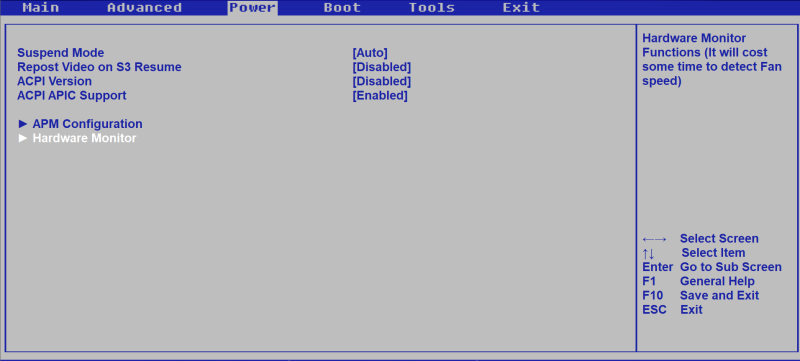
How to Check CPU Temperature through BIOS/UEFI
BIOS (Basic Input/Output System) and UEFI (Unified Extensible Firmware Interface) are firmware interfaces between a computer’s hardware and its operating system. BIOS is the traditional firmware used to initialize hardware during booting, while UEFI is a modern replacement with more features, including faster boot times, support for larger hard drives, and enhanced security.
There are some conditions to checking CPU temperature through BIOS:
This data will be accurate but not informative. It is calculated without any load or operations, meaning it may not be of great value. It is way more useful to check how your CPU works under the load of particular apps and tasks (games, video editors, WinRAR unzipping, etc.).
Not all PC manufacturers provide this temperature data, so you might not have access to it though BIOS.
Nevertheless, entering BIOS/UEFI mode to check the CPU temperature is precise and safe if you follow these simple steps and do not make any changes to the system configuration.
We cannot guarantee that the keys mentioned below will trigger the BIOS to load on your computer — please check your manufacturer’s guidelines for the most accurate instructions.
Turn off your PC and turn it back on.
Press the BIOS key during startup (commonly F2, DEL, ESC, or F10).
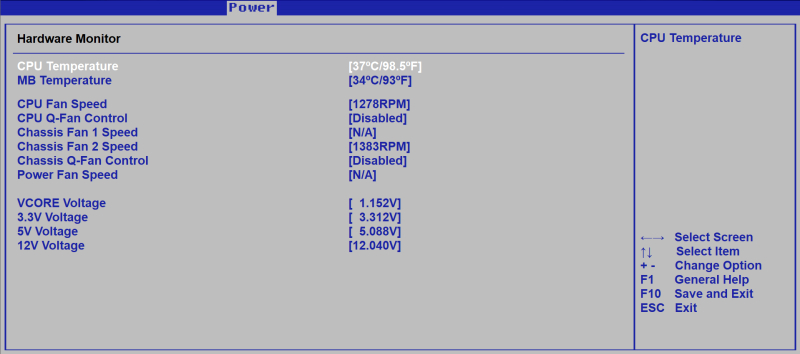
Use the arrow keys to go to the “Hardware Monitor,” “PC Health Status,” or similar section.
The CPU temperature should be displayed in this section.
Other Utilities for CPU Checks and Optimization
If you are curious about other apps that can help research CPU data, here are some more:
CPU-Z is a free system profiling and monitoring application for Windows that provides detailed information about the hardware in your computer.
Developed by CPUID, CPU-Z is a popular tool for enthusiasts, overclockers, and professionals who need to gather comprehensive data about their systems.
HARDiNFO is a comprehensive system information and benchmark tool for Windows. It offers detailed insights into PC hardware components, such as CPU, memory, and storage, along with advanced benchmarking capabilities. Users can test their PC’s performance and compare results online. The software also includes features for monitoring system processes, network traffic, and notebook battery health.
HARDiNFO provides well-organized graphical representations of hardware data and supports exporting reports in text or HTML formats. It has a free edition and a PRO version with additional features.
AIDA64 is a robust system information and diagnostic tool for various platforms, including Windows, Android, and iOS. It provides detailed insights into hardware and software components, supporting over 247,000 devices.
Key features include system stability testing, real-time monitoring, benchmarking, and extensive hardware detection. AIDA64 is available in different editions tailored for home users, engineers, and businesses, each with specific functionalities. It supports remote monitoring and can display data on various external devices.
CPU-X is a free and open-source system profiling and monitoring application, akin to CPU-Z but designed for GNU/Linux and FreeBSD. It provides detailed information about the processor, motherboard, memory, system, and graphics card, and includes performance monitoring.
CPU-X can operate in both graphical mode using GTK and text-based mode using NCurses, with an additional dump mode available via command line. It is maintained by “The Tumultuous Unicorn of Darkness”
Mission Center is a versatile system monitoring tool designed for Linux, offering detailed real-time insights into CPU, memory, disk, network, and GPU usage. It provides overall and per-thread CPU monitoring, detailed memory usage breakdowns, disk utilization, network interface details, and GPU statistics powered by NVTOP.
The tool uses OpenGL for graph rendering, minimizing resource usage, and supports a simplified summary view. Developed with GTK4 and Libadwaita, it is primarily distributed as a Flatpak package and is written in Rust.
SIW (System Information for Windows) is a comprehensive tool for Windows that provides detailed analysis of a computer’s hardware, software, and network configuration. It offers extensive information on components like the CPU, memory, storage devices, and more, as well as software details such as installed programs and licenses.
SIW features easy-to-generate reports in various formats and includes useful tools like network utilities and password recovery. It’s designed with a user-friendly interface and can run as a portable application without installation.
Neofetch is a command-line system information tool written in Bash. It displays essential system information alongside your OS logo or a custom image. Designed for aesthetic presentation, it’s highly configurable via command-line flags and a configuration file.
Neofetch supports nearly 150 operating systems, including Linux, Windows, and more obscure ones like Minix and Haiku. Its primary use is for visually appealing screenshots of system setups, rather than in-depth diagnostics.
FAQ
Why do I need to check CPU temperature?
There are several reasons:
Ensures the CPU does not overheat, which can cause system crashes or permanent hardware damage.
High temperatures can lead to thermal throttling, reducing the CPU’s performance to avoid damage.
Monitoring and managing temperatures can extend the lifespan of your CPU and other components.
High temperatures can indicate problems like inadequate cooling, dust buildup, or failing hardware components.
What temperature should my CPU be?
The ideal CPU temperature varies depending on the model, but the general guidelines for most CPUs are:
Idle temperature: 30°C to 40°C (86°F to 104°F)
Under load: 60°C to 80°C (140°F to 176°F)
Gaming and intensive tasks may push temperatures higher. It’s crucial to stay below 85°C to avoid throttling or damage. Check your CPU manufacturer’s guidelines for specific recommendations, as different CPUs have different thermal limits.
How can I reduce CPU temperature?
There are several steps you can take in addition to using a CPU optimizer like the Camomile app:
Ensure good case ventilation and remove any obstructions to airflow.
Regularly clean dust from fans, vents, and heatsinks.
Reapply thermal paste between the CPU and heatsink if it has dried out.
Use higher quality or additional fans, or upgrade to a liquid cooling system.
Lower CPU voltage and clock speed in BIOS or use power-saving modes.
Close unnecessary background applications and processes.
What’s the maximum temperature for a CPU?
The maximum safe temperature for a CPU varies by model, but generally, most CPUs are designed to operate safely up to around 95°C (203°F). However, it’s advisable to keep the temperature below 85°C (185°F) during intensive tasks to ensure longevity and prevent thermal throttling.
Don’t forget to share this post!
About Camomile
In-depth reviews of our products delivered to you by talented YouTube creators.
What is CPU Thermal Throttling? With great power comes great heat. Thermal throttling is a crucial concept in modern computing, acting as a safeguard for CPUs against the dangers of overheating....
Timesaver Summary It’s hard to imagine what kind of person is searching for information on CPU throttling, but the good news is this article is for both beginners and tech geeks alike. What is CPU...
Of course, the article’s title sounds like Donna Summer’s everlasting hit, and for a good reason. We are here to discuss a very common computer problem: computer overheating. And yes, this hot stuff can...